

This article provides an in-depth examination of key concepts relating to precipitation, runoff, and soil erosion in agricultural contexts, highlighting measurement techniques, calculations, factors influencing these phenomena, and conservation practices.
 |
| IMAGE SOURCE |
Precipitation in Agriculture
Rainfall Measurement
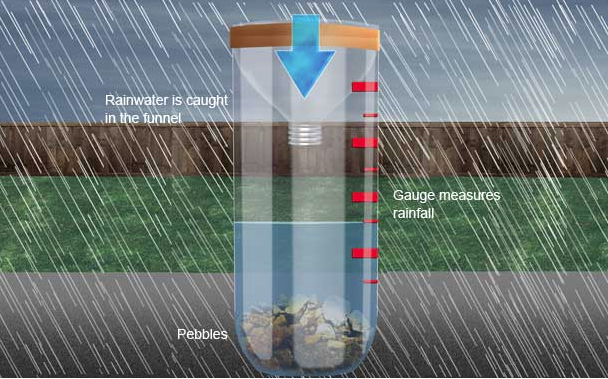
- Rain Gauge: The primary instrument for measuring rainfall.
- Standard Non-Recording Rain Gauge:
- Catch diameter: 8 inches.
- Inner cylinder area: 0.1 of the catch area.
- Recording Rain Gauge: Records rain over time on a graph paper.
- Standard Non-Recording Rain Gauge:
Location of Rain Gauges
- The top of the rain gauge must be at least 75 cm above ground level.
- The distance from any obstruction must be at least twice the height of that obstruction.
- The gauge should be placed on level ground for accurate measurement.
Mean Rainfall Data Calculation
- Arithmetic Mean:
Theissen Polygon Method:
- Plot rain gauge locations on the area map.
- Connect stations with straight lines.
- Construct perpendicular bisectors to enclose each rain gauge within a specified area.
- Compute mean rainfall using a weighted mean based on these areas.

Isohyetal Method:
- Draw lines of equal rainfall (isohyets) through interpolation.
- Determine the area between successive isohyets and compute mean rainfall using Theissen's method.
Frequency Analysis
- Purpose: To design conservation structures for maximum runoff based on rainfall frequency.
- Recurrence Interval: Number of years one would expect a storm of specified duration and intensity to occur.
Calculation Procedure
- Organize rainfall records in descending order.
- Define as record length (in years) and as the ranking.
- Calculate probability and recurrence interval .

Plot the magnitude and probability on normal, log-normal, or log-log probability paper to estimate maximum expected rainfall.
Runoff
Factors Affecting Runoff
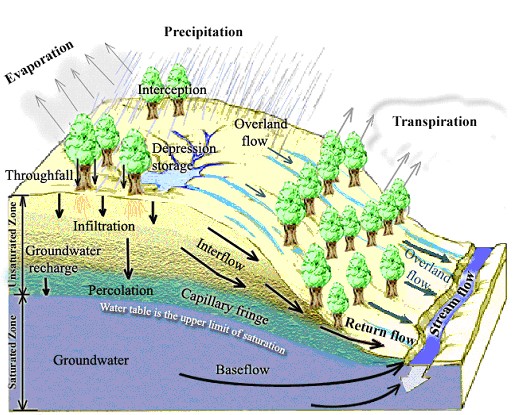
- Precipitation: Total rainfall impacting runoff volume.
- Interception: Water captured by vegetation before it reaches the ground.
- Evaporation: Loss of water back to the atmosphere.
- Transpiration: Plant moisture loss contributing to overall water loss.
Physiographic Factors
- Watershed Characteristics: Size and shape affecting runoff patterns.
- Slope: Steeper slopes typically yield increased runoff.
- Land Use: Different uses can alter runoff efficiency.
- Infiltration Characteristics: Soil's capacity to allow water to penetrate.
- Soil Type: Various soil textures can significantly impact runoff rates.
Channel Characteristics
- Size and Shape: Larger or more irregular channels can alter flow dynamics.
- Cross-section Slope: Influences flow speed and volume.
- Roughness of Channel Bed: Impact of surface texture on flow resistance.
Rational Method for Computing Runoff
Formula:
- = Peak runoff rate (cms or cfs)
- = Rainfall intensity (mm/h or in/h)
- = Catchment area (ha or acres)
- = Runoff coefficient (ratio of peak runoff to rainfall intensity)
Time of Concentration :
- Metric:
- English Units:
Hydrographs
| IMAGE SOURCE |
Basic hydrograph is a synthetic hydrograph plotted over 100 arbitrary units of flow and 100 arbitrary units of time. It is an average hydrograph based on flow records of similar watersheds.
· The peak flow. Q, and the runoff volume, V, must be estimated first.
· The runoff hydrograph is determined from the basic hydrograph using the factors l, m, and n.
·
If the area under the basic hydrograph is 3000
sq. units, each sq. unit in the basic hydrograph will have a value of: 1 =
V/3000
·
The factor m is the ratio of the peak runoff Q
to the peak flow of 100 in the basic hydrograph, therefore, each unit of flow
in the basic hydrograph will have a value of m = Q/100.
·
The factor n is the value that each unit of time
on the basic hydrograph represents in the hydrograph of the selected storm. On
this hydrograph, 1/100 of the peak flow times 1/100 of the duration must equal
1/3000 of the runoff volume. Since, m is
1/100 of the design peak flow, n must be equal to 1/100 of the design duration
and 1 is 1/3000 of the design volume, i.e. m*n = I or n = l/m.
When runoff rate is expressed in cms, runoff volume in
ha-m and time in minutes.

Unit hydrograph – The unit hydrograph is a natural or
synthetic hydrograph for one unit of direct runoff from the catchment in a
specified unit of time.
To develop a unit hydrograph, the steps are as follows:
·
Subtract the base flow, if any, from the total
runoff.
·
Compute the base flow, if any, from the total
runoff.
· Compute runoff volume,
· Compute total volume, V
·
Compute Average depth of rainfall excess over the
catchment area, d = V/A
·
Compute the runoff rate, Qu, for each
time period in the unit hydrograph, Qui = Qi/d
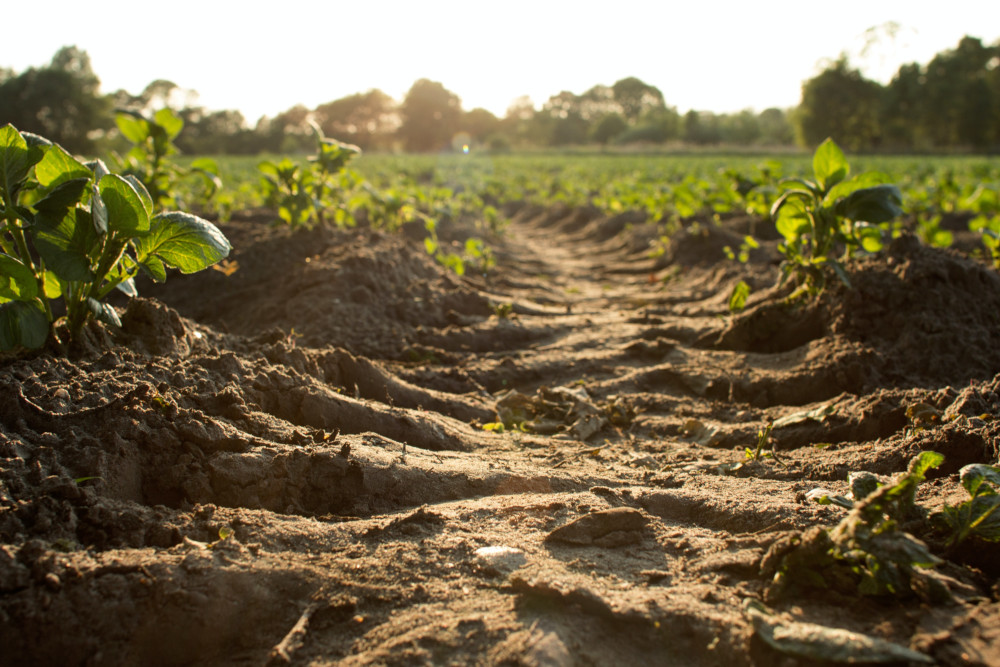
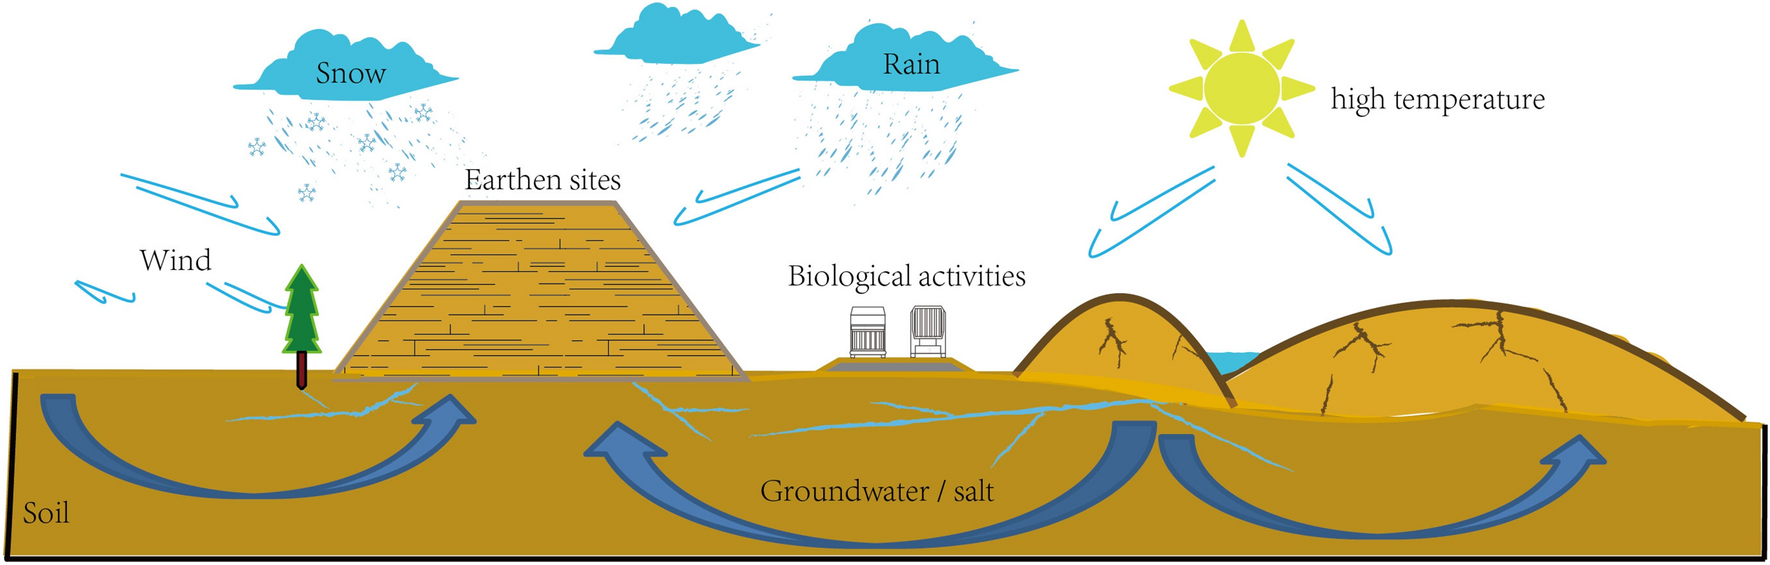
Soil Erosion
 |
| IMAGE SOURCE |
- Decreased soil fertility.
- Raised stream beds, reducing their capacity.
- Silting of reservoirs, affecting lifespan and usability.
- Drainage issues on agricultural lands due to deposition of eroded soil.
Types of Soil Erosion
- Water Erosion:
- Sheet Erosion: Uniform removal of thin soil layers.
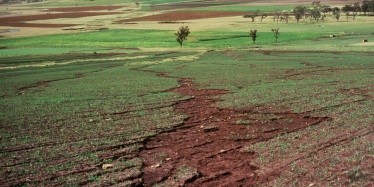
- Rill Erosion: Formation of small channels or rills.

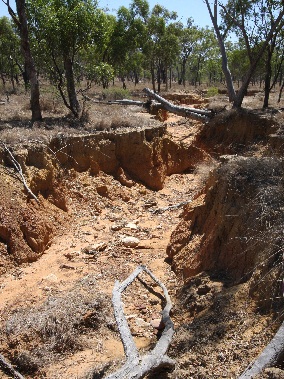
- Gully Erosion: Development of large channels from rills.
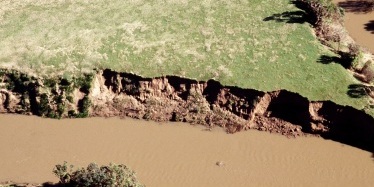
- Stream Bank Erosion: Loss of soil from bank sides due to flowing water.
- Coastal Erosion: Wave action eroding shorelines.
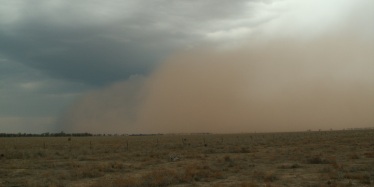
- Wind Erosion: High winds displace soil from barren lands.
- Slip Erosion: Landslides caused by saturated conditions on steep slopes.
| IMAGE SOURCE: |
Factors Affecting Soil Erosion
Climatic Factors
- Precipitation: Amount, intensity, and duration can significantly influence erosion.
- Wind: High-velocity winds can lead to wind erosion, particularly in arid areas.
- Temperature and Humidity: Affect soil moisture levels and vegetation growth, influencing soil stability.
- Solar Radiation: Impacts soil temperature and moisture content.
Soil Physical Properties
- Soil Structure: The arrangement of soil particles affects water movement and erodibility.
- Soil Texture: Proportions of sand, silt, and clay influence erosion risk.
- Organic Matter Content: Enhances soil structure and reduces erosion.
- Moisture Content: Affects cohesion and weight of soil, influencing erosion potential.
- Bulk Density: Higher bulk density often leads to decreased porosity and increased erosion.

Role of Vegetation
- Interception: Vegetation captures rainfall, reducing the impact of raindrops on soil.
- Transpiration: Decreases soil moisture, maintaining soil stability.
- Root Systems: Bind soil together, making it more resistant to erosion.
- Decayed Roots: Create pores in the soil, enhancing infiltration.
- Surface Friction: Increases with vegetation cover, reducing runoff velocity.

Topography
- Slope: Steeper slopes typically have higher erosion rates.
- Slope Length: Longer slopes can lead to greater runoff and soil loss.
- Watershed Shape and Size: Influences how water flows and accumulates.
Erosivity and Erodibility
- Erosivity: Refers to the potential ability of rainfall to cause erosion, determined by rainfall intensity and duration.
- Erodibility: Indicates soil's susceptibility to erosion based on its physical properties and land management practices.
Universal Soil Loss Equation (USLE)
The average soil loss can be estimated using the following equation:
Where:
- = Average soil loss for the given period
- = Rainfall erosivity index
- = Soil erodibility factor
- = Length of slope factor
- = Slope factor
- = Cropping management factor
- = Conservation practice factor
Conservation Measures for Agricultural Lands
Techniques to Mitigate Soil Erosion
- Contour Cultivation: Farming along the contour lines to reduce water flow velocity.
- Strip Cropping: Growing alternating crops to act as barriers against soil erosion.
- Cropping Systems: Implementing crop rotation and mixed cropping strategies.
- Contour Benching: Creating trenches along the contour to hold water.
- Bench Terracing: Constructing platforms along slopes to reduce erosion.
- Small Embankments: Using stone embankments across hillsides to control runoff.
Gully Erosion and Control
Gully Formation
- Gully Erosion begins with small rills and develops over time due to increased runoff, steep slopes, and specific soil characteristics.
Control Measures
- Grassed Waterways: Constructed to intercept runoff and stabilize slopes.
- Vegetation: Planting can help stabilize gully sides, reducing runoff speeds.
- Chute Spillways: Structures designed to mitigate the energy of flowing water.
Soil-Plant-Water Relationships
Types of Soil Water
- Hygroscopic Water: Tightly held water that plants cannot extract.
- Capillary Water: Water held in the soil by capillary forces, available for plants.
- Gravitational Water: Freely draining water that moves through the soil due to gravity.
Key Water Relationships
- Field Capacity: The moisture level retained after excess gravitational water has drained.
- Permanent Wilting Point (PWP): The moisture level at which plants can no longer extract water.
- Available Water: Water between field capacity and PWP, usable by plants.
- Infiltration: The process of water moving from the surface into the soil.
- Water Intake: Movement of irrigation water into the soil.
- Percolation: Downward water movement through saturated soil, similar to infiltration when the soil is saturated.
- Seepage: Lateral water movement from sources like reservoirs or canals.
- Permeability: Soil's ability to transmit water, measured as hydraulic conductivity.
- Evaporation: Transformation of liquid water into vapor.
- Transpiration: Water vapor release from plants into the atmosphere.
- Evapo-transpiration: Total water loss from plants and soil.
Grassed Waterways
Definition and Purpose
- Grassed Waterways: Open channels lined with grass that facilitate safe runoff conveyance while preventing soil erosion.
Functions
- Act as outlets for terraces and graded bunds.
- Safely transport runoff from various agricultural structures.
- Serve as emergency spillways for farm ponds, reducing erosion potential and managing water flow.
Design of Grassed Waterways
Grassed waterways are critical in managing runoff and preventing soil erosion in agricultural landscapes. The design of these waterways can take several shapes depending on the specific site requirements and flow conditions. Here is an overview of the three common shapes of grassed waterways: trapezoidal, triangular, and parabolic, along with their characteristics and design considerations.

1. Trapezoidal Shape

Characteristics:
- Cross-Section: The cross-section of trapezoidal waterways resembles a trapezoid with a wider top and narrower bottom.
- Side Slopes: Typically designed with side slopes ranging from 3:1 to 4:1 (horizontal to vertical) for stability.
Advantages:
- Stability: Generally more stable and can handle higher flow rates.
- Constructability: Easier to construct with conventional equipment.
- Sedimentation Control: The broader top can help slow down the water flow, encouraging sedimentation among grasses.
Design Considerations:
- Width: The top width should accommodate expected water flow without overtopping.
- Depth: Sufficient depth is necessary to handle peak flows while maintaining a vegetated surface.
- Side Slopes: Carefully designed to ensure they remain stable under saturated conditions.
Formula:
For trapezoidal waterways, the flow area and the hydraulic radius can be calculated as follows:
where:
- = bottom width
- = top width
- = depth
- = wetted perimeter
2. Triangular Shape

Characteristics:
- Cross-Section: Similar to an isosceles triangle.
- Side Slopes: Typically ranges from 2:1 to 3:1.
Advantages:
- Efficient Use of Space: Requires less earthmoving than trapezoidal shapes.
- Easy Construction: Can be easier to shape using hand tools.
Design Considerations:
- Depth and Side Slopes: Care must be taken to ensure the side slopes are not too steep to avoid failure.
- Flow Maintenance: Ensure that the flow does not exceed the designed channel capacity to prevent erosion at the toe of the slopes.
Formula:
For triangular waterways, the area and hydraulic radius can be defined as:
where:
- = base width of the triangle
- = height of the triangle
- = wetted perimeter
3. Parabolic Shape
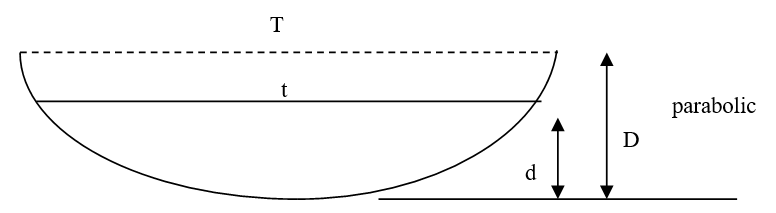
Characteristics:
- Cross-Section: Gently curves, providing a smooth transition for flowing water.
- Flow Characteristics: Water flows evenly across the channel due to a consistent slope.
Advantages:
- Erosion Resistance: The gentle slope helps reduce the velocity of runoff, thus minimizing erosion.
- Aesthetic Appeal: Visually more appealing and blends better into the landscape.
Design Considerations:
- Width and Depth: Must be appropriate to handle the expected flow rates while maintaining a vegetated surface.
- Side Slopes: Designed to be stable and prevent undercutting.
Formula:
For parabolic waterways, you can estimate the area influenced by the parabolic equation; however, simplified calculations often use average values of width and depth for design:
Where:
- = width at the top of the channel
- = depth of the channel
General Design Considerations
Flow Capacity
- The design must accommodate the expected maximum flow to prevent overtopping and erosion.
Vegetation
- Appropriate grasses need to be selected based on local climate, soil type, and the expected flow characteristics. Deep-rooted grasses can provide additional soil stability.
Maintenance
- Regular maintenance is necessary to ensure that vegetation remains robust and free from invasive species or sediment buildup, which can diminish the effectiveness of the grassed waterway.
Slope and Site Conditions
- Local topography and soil characteristics significantly influence the design; thus, these factors must be evaluated before implementation.
By selecting the appropriate shape and carefully designing the grassed waterway, agricultural practices can effectively manage runoff, reduce soil erosion, and promote ecological sustainability.
Velocity of Flow
Flow Velocity in Grassed Waterways
The velocity of flow through grassed waterways is crucial for preventing erosion and ensuring efficiency.
- Design Velocity Range: Typically, an average velocity of 1.5 m/s to 2 m/s is used for design considerations.
Manning’s Formula
To calculate the velocity of flow in open channels, Manning's formula is employed:
Where:
- = flow velocity (m/s)
- = Manning's roughness coefficient (dimensionless), varying based on vegetation type and channel conditions.
- = hydraulic radius (m), calculated as where is the cross-sectional area and is the wetted perimeter.
- = slope of the energy grade line or channel slope (dimensionless).
Adjustment Process
- If the velocity calculated from Manning's formula exceeds the permissible velocity, the cross-sectional design is modified (e.g., by varying depth or width) and recalculated.
- This iterative process continues until the desired flow velocity, within the acceptable range, is achieved.
Design of Drop Structures
Weir Formula
The design of drop structures utilizes the standard weir formula to estimate discharge over the weir:
Where:
- = peak discharge (m³/s)
- = length of the weir crest (m)
- = head (or height of water) over the weir (m)
- = coefficient of discharge (typically 1.66 for sharp-crested weirs)
Calculation of Crest Length
The length of the weir crest can be calculated as follows:
Where:
- = height of the headwall (m)
- = total height, including freeboard (generally 15 to 20 cm)
Design of Chute Spillways
Crest Length
Similar to drop structures, the crest length of a chute spillway is calculated using the weir formula defined above.
Velocity at the Toe
The velocity of flow at the downstream toe of the spillway can be calculated using:
Where:
- = acceleration due to gravity (approximately 9.81 m/s²)
- = total drop (m)
- = frictional head loss over the apron (calculated as 10% of H)
Depth of Flow at the Toe
The depth of flow at the toe can be determined from the discharge equation:
Where:
- = width of the flow at the toe (m)
- = depth of flow at the toe (m)
- = velocity at the toe (m/s)
Hydraulic Jump Analysis
A hydraulic jump may form on the horizontal section of the basin, characterized by changes in flow depth. The relationship between upstream and downstream depths is given by:
Where:
- = Froude number, calculated as:
- = depth of flow upstream (m)
Summary
The design of grassed waterways, drop structures, and chute spillways requires careful consideration of flow velocities, structural dimensions, and hydraulic principles. By using Manning’s formula and the weir formula, engineers can ensure that these systems effectively manage water flow while minimizing erosion and providing stability. The iterative design process ensures that structures are optimized for the site-specific conditions and requirements, contributing to sustainable water management practices.
.png)
.png)
.png)
0 Comments